Broadcast Still Rules? Why OzTAM’s Streamscape Data Paints a Contested Picture of Australia’s Viewing Habits

Robert Ong
Managing Director

The 2025 Streamscape report marks a milestone for unified TV measurement in Australia, but alternative data sources raise key questions about how we define “total viewing.”
On the 30th of June 2025 OzTAM released its groundbreaking “Streamscape” report, offering the first “independent, unified view of total video consumption in Australia”.
Key Findings from OzTAM’s Streamscape Report
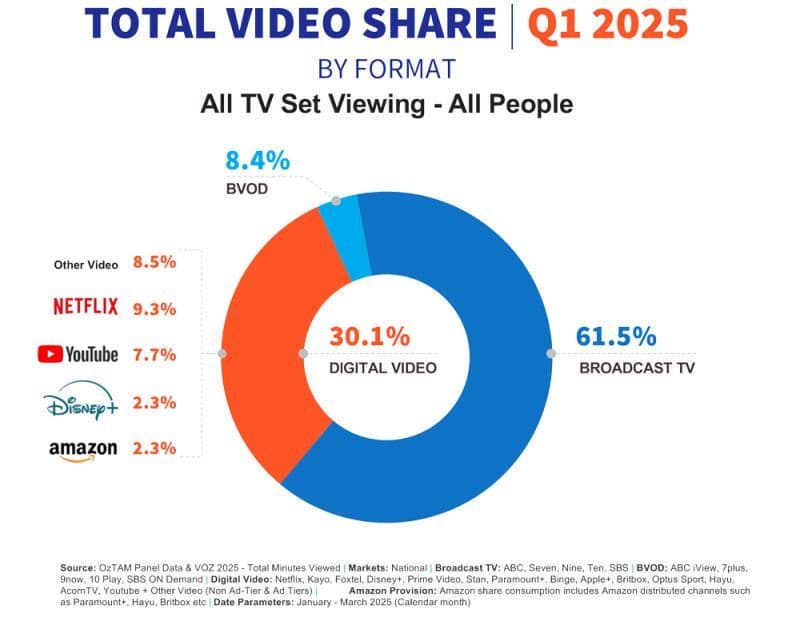
One of the most significant findings was that broadcast free-to-air television, that is TV consumed via an aerial (those things on our roofs that are rarely being installed anymore) accounts for 61.5% of total viewing time across all people. This was followed by BVOD at 8.4% and ‘Digital Video’ at 30.1% – this being a catch-all bucket for all other streaming services (e.g. Netflix, YouTube, Prime, Disney, etc.).
How Connected TVs Change the Viewing Picture
- It’s based on a survey of roughly 5,000+ homes with Streaming TV Meters installed
- Critically, 23% of the total panel are not connected TV’s (CTV’s). This means 100% of viewing time on this 23% is 100% broadcast. One can only assume this is an accurate picture of the state of Australia’s TV composition right now. I’d love to know how and on what basis quota management and representativeness is done, and on what frequency.
- When adjusted for only CTV’s the consumption looks a little different:
Broadcast TV = 50%
BVOD = 10.9%
Digital Video = 39.1%
Comparing OzTAM, Samsung, and ACMA Data
When comparing OzTAM’s figures against alternative data sources, Broadcast TV doesn’t quite dominate the living room.
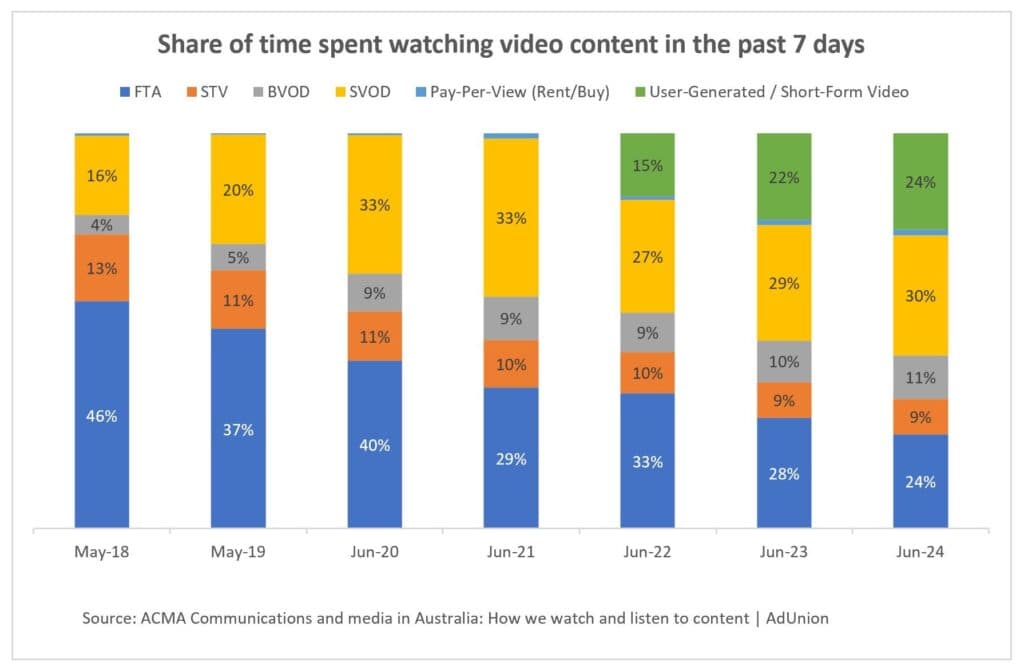
ACMA’s Communications and media in Australia report, which looks at viewing video habits over 7 days every year for the last 7 years now shows FTA at 24% or if you look at FTA/STV combined it’s 33%. It’s not quite apples for apples but it’s an interesting alternative view.
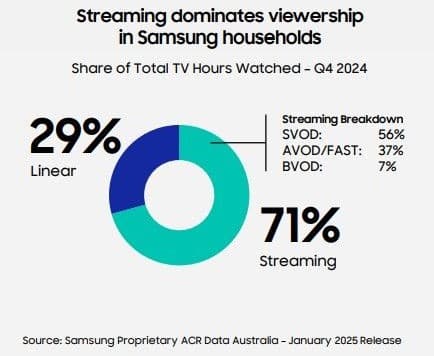
Samsung’s proprietary ACR data provides another interesting view. Its panel size in Australia is huge at 3.4m CTVs. Based on data from Q4 2024 broadcast made up 29% of total viewing time with streaming at 71%. That’s a stark difference to OzTAM’s numbers – but why?
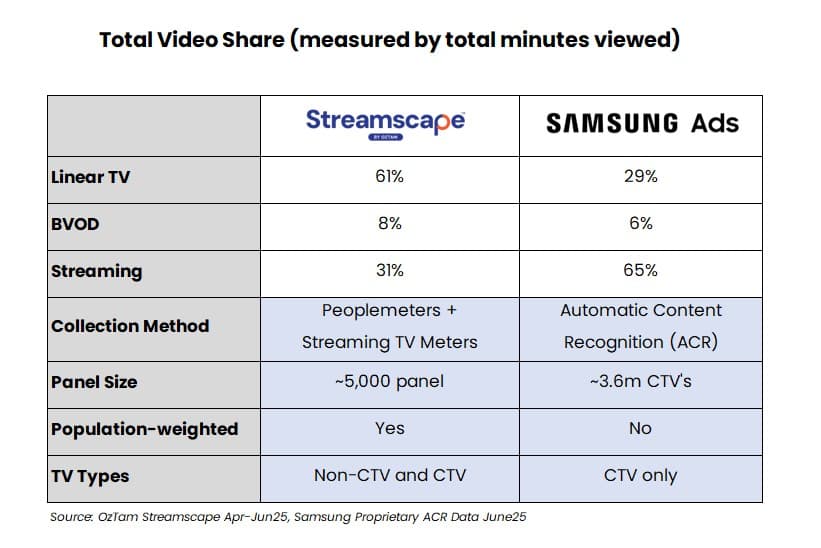
- As mentioned above, OzTAM include ~20% non-CTV’s in their calculation which accounts for at least a ~10% swing
- Clearly the older demos (60+) on OzTAM’s streaming TV meters (that is those with a CTV) are watching A LOT of linear which is skewing these numbers, above and beyond non-CTV viewers
- While I disagree that Samsung’s numbers are materially skewed by socioeconomic group, they aren’t population-weighted by demo so although they are sizable – they would skew younger which would account for some of this discrepancy
- Samsung’s data is really powerful. It’s hard to dismiss the behaviour of 3.6m TVs, so should rightly help inform investment alongside OzTAM and other data sources.
I am, as many are, genuinely excited about this new development – it’s super helpful to have another quality data source from a trusted industry body but it also highlights just how fragmented and nuanced audience measurement has become in the streaming era.