


See the Return on Your Streaming TV & Audio Investment
AdMatch™ connects streaming TV and audio exposures directly to online sales, leads and revenue — one dashboard, updated daily, across every platform on your plan.
Request a DemoMajor streaming publishers measured in one report.
Your dashboard updates every day.
Avg improvement in streaming CPA.
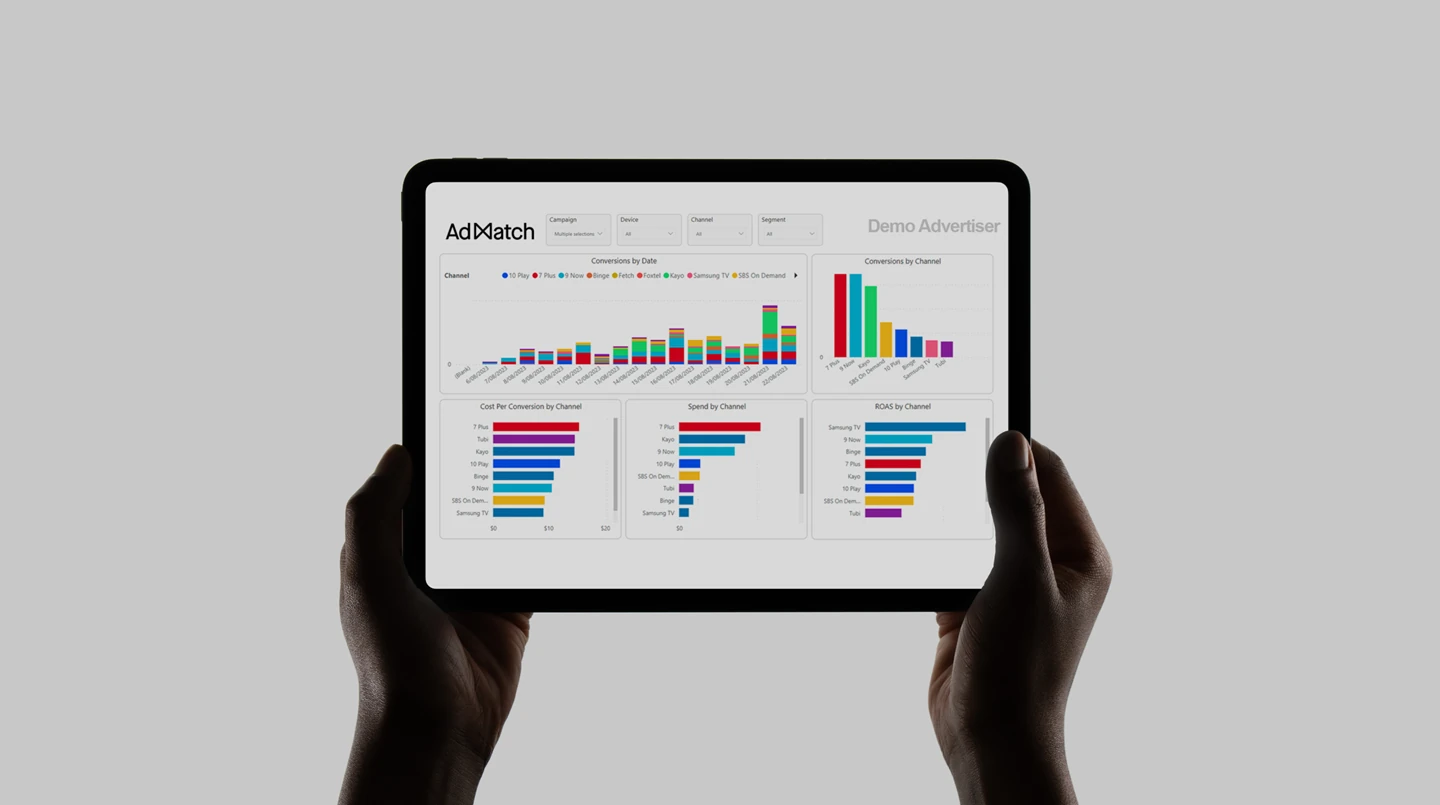
Measure streaming by what it returns
Reach and frequency tell you how a campaign was delivered. AdMatch™ adds what it returned: whether it generated sales, and at what cost.
It reports cost per sale and return on ad spend by publisher, time of day, device, geography and creative, updated daily, so we can move your investment while the campaign is still live.
of Australian adults used paid subscription streaming (Netflix, Stan, Binge) weekly in 2025, vs. 52% for traditional free-to-air TV.
(ACMA, 2025)
of Australian adults use online music streaming, vs. 64% who listen to radio — streaming has overtaken radio for the first time.
(ACMA, 2025)
How it works
Three Steps: Define, Match and Optimise
- Define
Name the event that matters
It could be a sale, a lead, a booking or a store visit. We measure whatever your business counts as a result.
- Match
Match exposures to events
We match streaming TV and audio exposures to those events at household level, with double-counting removed across every platform on your plan.
- Optimise
Optimise while it is running
Daily reporting means we can move your budget toward the publishers, times of day and creative that are converting while the campaign is still live.
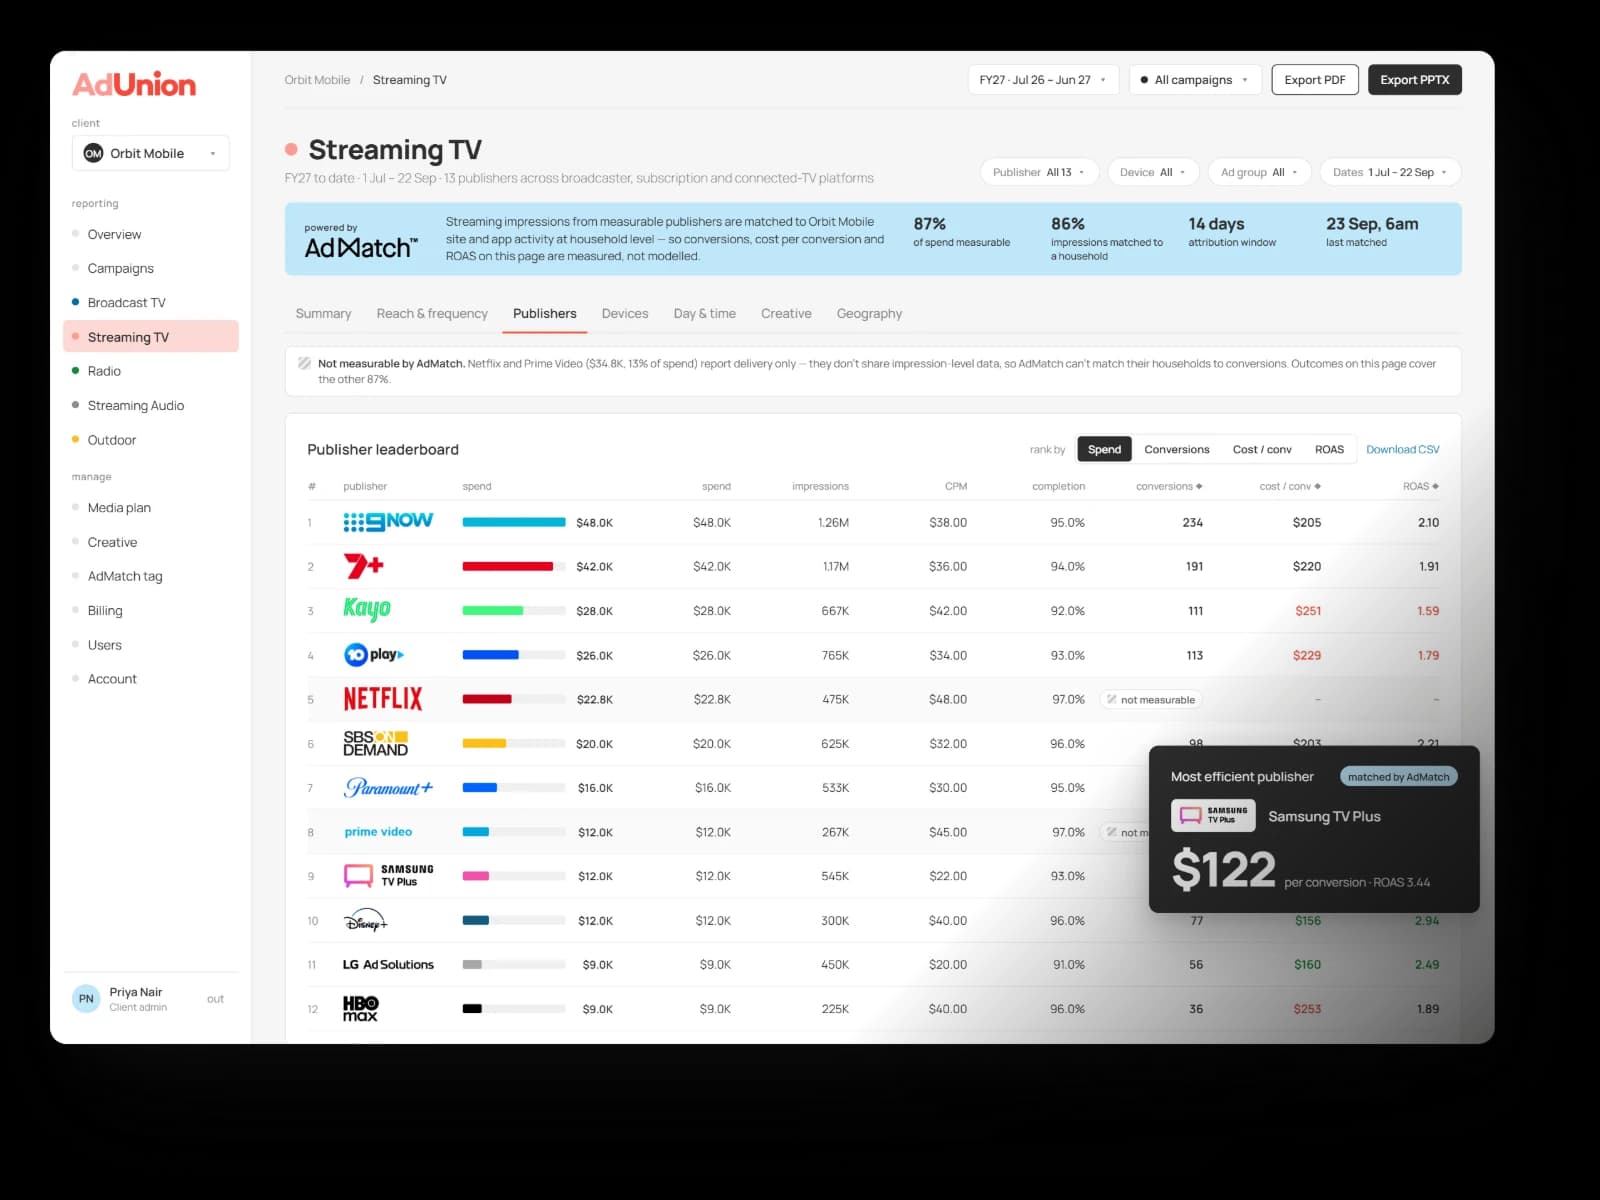
One dashboard, updated daily
Your team can open a live view at any time, so we can adjust a campaign together while it is still running.
- Single view
- Every streaming platform on your plan, in one dashboard.
- Cost per sale
- By publisher, daypart, device, geography and creative.
- ROAS
- Revenue attributed against media cost.
- De-duplicated reach
- Your unique audience across platforms.
- Time to conversion
- How long after exposure the sale lands.
- Geographic insights
- Between states, and metro versus regional.
Platforms we measure
Matched
Streaming TV and audio attribution across major networks and platforms
All included in a single buy, reported in a single dashboard - updated daily.












Case study · Snaffle
A 40% Lower Cost per Acquisition in Three Months
Nine streaming networks bought in one plan, every signup tracked back to source, audio added once the numbers had earned it.
Read the case studyQuestions
What Clients Ask First
Can we use AdMatch™ with our current agency?
AdMatch™ works on streaming TV and audio campaigns that AdUnion plans and buys. We set it up from the start of your campaign, and after the first month of data we usually find ways to improve the plan together.
Is this just attribution with a new name?
No, it works differently from click-based attribution. AdMatch™ matches streaming ad exposures to your sales and leads, including the ones where nobody clicked.
Who owns the data?
You do. Reporting is yours to keep, and it leaves with you if you leave.
What does it cost?
A small amount relative to the media it measures. Depending on the size of your campaign, it is charged as either a small percentage of your streaming spend or a fixed fee, and we agree which up front so there are no surprises.
See AdMatch™ in action
We'll take you through a live dashboard in about twenty minutes and show you how AdMatch™ would measure your streaming TV and audio campaigns with AdUnion.
Request a walkthrough